The 2020 - 2021 winter brought cold weather back to the First Coast- a change from some of the previous years. The mercury hit freezing seven times during the month of December and reached hard freeze status 3 times. And when the mercury wasn't cold, we were likely experiencing rain from several storm systems.
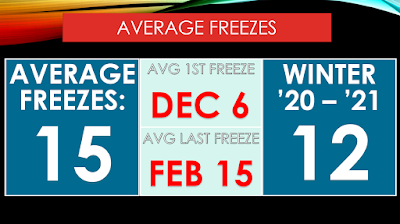
Despite the cold weather, the winter wasn't extreme enough to produce more freezes than average. An average winter produces around 15 freezes and 5 hard freezes. This winter produced 12 freezes and 3 hard freezes. The less than average amount of freezes has been a trend seen since the 1970s, with some exceptions.
It is classic for La Nina winters in the Southeast to be drier and warmer than average; however, most of Florida's recent winter resembled an El Nino weather pattern, with abundant precipitation and cooler temperatures.
The 2020-2021 La Nina value averaged around 1.2, which is considered moderate. So why didn't the atmosphere get the message? It appears the jet stream was altered by a couple of different influences. A massive ridge was dominant over eastern Canada and Greenland while the northern Pacific saw heights below normal. This allowed several cold fronts to push into Northeast Florida, with cold air following.
2020-2021 Winter Summary:
TEMPERATURE (F)
RECORD
 HIGH             89   02/13/2020
 LOW               7   01/21/1985
HIGHEST           86   02/18         84       2       89  02/13
LOWEST            26   12/26         24       2       32  01/21
                                                          01/22
AVG. MAXIMUM    66.9               67.2    -0.3     71.5
AVG. MINIMUM    43.3               44.3    -1.0     51.5
MEAN            55.1               55.8    -0.7     61.5
DAYS MAX >= 90     0                0.0     0.0        0
DAYS MIN <= 32    12               12.0     0.0        2

PRECIPITATION (INCHES)
RECORD
 MAXIMUM       24.38   1998
 MINIMUM        1.14   1890
TOTALS         10.94               9.29    1.65     5.11
DAILY AVG.      0.13               0.10    0.03     0.11
DAYS >= .01       26               23.0     3.0       MM
DAYS >= .10       19               14.0     5.0       MM
DAYS >= .50        9                6.0     3.0       MM
DAYS >= 1.00       3                3.0     0.0       MM
GREATEST
 24 HR. TOTAL   1.44

SNOWFALL (INCHES)
RECORDS
 TOTAL           1.9   MM
TOTALS           0.0                  T     0.0      0.0

DEGREE DAYS
HEATING TOTAL    938                960     -22      442
 SINCE 7/1      1001               1132    -131       MM
COOLING TOTAL     56                 50       6      142
 SINCE 1/1        48                 34      14       MM
................................................................

WIND (MPH)
AVERAGE WIND SPEED              6.6
HIGHEST WIND SPEED/DIRECTION    37/280    DATE  01/31
HIGHEST GUST SPEED/DIRECTION    46/310    DATE  12/24
                                46/MM           01/31

SKY COVER
AVERAGE SKY COVER           0.57

AVERAGE RH (PERCENT)     75

WEATHER CONDITIONS. NUMBER OF DAYS WITH
THUNDERSTORM             11     MIXED PRECIP               0
HEAVY RAIN               15     RAIN                      23
LIGHT RAIN               34     FREEZING RAIN              0
LT FREEZING RAIN          0     HAIL                       0
HEAVY SNOW                0     SNOW                       0
LIGHT SNOW                0     SLEET                      0
FOG                      49     FOG W/VIS <= 1/4 MILE     10
HAZE                      0


Comments